3QFY2019 Result Update | IT
February 6, 2019
Tech Mahindra
NEUTRAL
CMP
`750
Performance Highlights
Target Price
-
(` cr)
3QFY19
2QFY19
% chg (qoq)
3QFY18
% chg (yoy)
Investment Period
12 Months
Net revenue
8,944
8,630
3.6
7,776
15.0
EBITDA
1,723
1,619
6.4
1,265
36.2
Stock Info
EBITDA margin (%)
19.3
18.8
50bps
16.3
300bps
Sector
IT
Adj. PAT
1,203
1,064
13.0
942
27.7
Market Cap (` cr)
73,597
Source: Company, Angel Research;
Net Debt (` cr)
(6,370)
Tech Mahindra posted good numbers for 3QFY2019 on all fronts. Revenues rose
Beta
0.7
3.5% qoq to end the period at US$1,261mn. On CC (constant currency) terms of
52 Week High / Low
780/564
the 4.3% qoq. In Rupee terms, revenues came in at `8,944cr v/s. `8,630cr in
Avg. Daily Volume
70,803
2QFY2019, up 3.6% qoq. On the operating front, the EBITDA margin came in at
Face Value (`)
5
19.3% v/s. 18.8% in 2QFY2019, a qoq expansion of 50bps. Consequently, PAT
BSE Sensex
36,617
came in at `1,203cr v/s. `1,064cr in 2QFY2019, a growth of 13.0% qoq. The stock
Nifty
10,934
has witnessed a good run-up and hence offer little upsides in near term;
Reuters Code
TEML.BO
hence, we maintain our neutral rating.
Bloomberg Code
TECHM@IN
Result highlights: Revenues rose 3.5% qoq to end the period at US$1,261mn.
Shareholding Pattern (%)
On CC (constant currency) terms of the 4.3% qoq. In Rupee terms, revenues
Promoters
35.9
came in at `8,944cr v/s. `8,630cr in 2QFY2019, up 3.6% qoq. The sales growth
MF / Banks / Indian Fls
14.8
during the quarter was broad based in terms of services, while in geographies it
FII / NRIs / OCBs
39.5
was USA and ROW, which drove the growth while Europe saw a moderate qoq
Indian Public / Others
9.8
growth. On the operating front, the EBITDA margin came in at 19.3% v/s. 18.8%
in 2QFY2019, a qoq expansion of 50bps. Consequently, PAT came in at `1,203cr
v/s. `1,064cr in 2QFY2019, a growth of 13.0% qoq.
Abs.(%)
3m 1yr
3yr
Sensex
4.8
5.4
48.7
Outlook and valuation: We expect a CAGR of 6.8% and 10.2% in USD and INR
Tech Mahindra
7.9
19.2
57.9
revenue respectively over FY2018-21E. The PAT is expected to grow at a
CAGR of 10.1% over FY2018-21E. We recommend our neutral rating.
Key financials (Consolidated, Indian GAAP)
3-year price chart
Y/E March (` cr)
FY2018
FY2019
FY2020E
FY2021E
Net sales
30,773
35,500
37,985
41,214
% chg
5.6
15.4
7.0
8.5
Net profit
3,800
4,498
4,693
5,072
% chg
35.1
18.4
4.3
8.1
EBITDA margin (%)
15.3
18.6
19.3
19.3
EPS (`)
43.0
50.9
53.1
57.4
P/E (x)
17.4
14.7
14.1
13.1
P/BV (x)
3.5
3.1
2.8
2.5
RoE (%)
20.2
21.2
19.8
19.2
Source: Company, Angel Research
RoCE (%)
15.4
20.7
21.1
20.9
EV/Sales (x)
2.3
2.0
1.9
1.7
Sarabjit kour Nangra
EV/EBITDA (x)
15.3
10.8
9.7
9.0
+91 22 3935 7800 Ext: 6806
Source: Company, Angel Research; Note: CMP as of February 5, 2019
Please refer to important disclosures at the end of this report
1
Tech Mahindra | 3QFY2019 Result Update
Exhibit 1: 3QFY2019 performance (Consolidated, Indian GAAP)
(` cr)
3QFY19
2QFY19
% chg (qoq)
3QFY18
% chg (yoy)
9MFY19
9MFY18
% chg (yoy)
Net revenue
8,944
8,630
3.6
7,776
15.0
25,850
22,718
13.8
Cost of revenue
5,985
5,692
5.1
5,381
11.2
13,201
12,479
5.8
Gross profit
2,959
2,938
0.7
2,395
23.5
12,649
10,240
23.5
SG&A expense
1,237
1,319
(6.2)
1,131
9.4
7,989
6,935
15.2
EBITDA
1,723
1,619
6.4
1,265
36.2
4,660
3,305
41.0
Dep. and amortization
284
294
(3.7)
274
3.4
859
786
9.2
EBIT
1,439
1,324
8.7
991
45.3
3,801
2,519
50.9
Interest
36
39
(7.7)
34
5.0
105
110
(4.2)
Other income
81
175
(54.0)
225
(64.2)
367
958
(61.7)
PBT
1,484
1,461
1.6
1,181
25.6
4,063
3,367
20.7
Income taxes
264
391
(32.6)
257
2.6
901
812
11.0
PAT
1,220
1,069
14.1
924
32.0
3,162
2,555
23.7
Minority interest
17
5
-
(19)
(3)
(22)
PAT after minority interest
1,203
1,064
13.0
943
27.5
3,165
2,578
22.8
Profit from associates
-
-
-
-
-
Exceptional item
-
-
-
-
-
Reported PAT
1,203
1,064
13.0
943
27.5
3,165
2,578
22.8
Adj. PAT
1,203
1,064
13.0
943
27.5
3,165
2,578
22.8
Diluted EPS
13.5
11.9
12.7
10.6
26.8
35.7
29.3
21.6
Gross margin (%)
33.1
34.0
(95)bps
30.8
228bps
48.9
45.1
386bps
EBITDA margin (%)
19.3
18.8
50bps
16.3
300bps
18.0
14.5
348bps
EBIT margin (%)
16.1
15.3
75bps
12.7
335bps
14.7
11.1
362bps
PAT margin (%)
13.4
12.3
112bps
12.1
132bps
12.2
11.3
90bps
Source: Company, Angel Research
Revenue growth led by USA & ROW
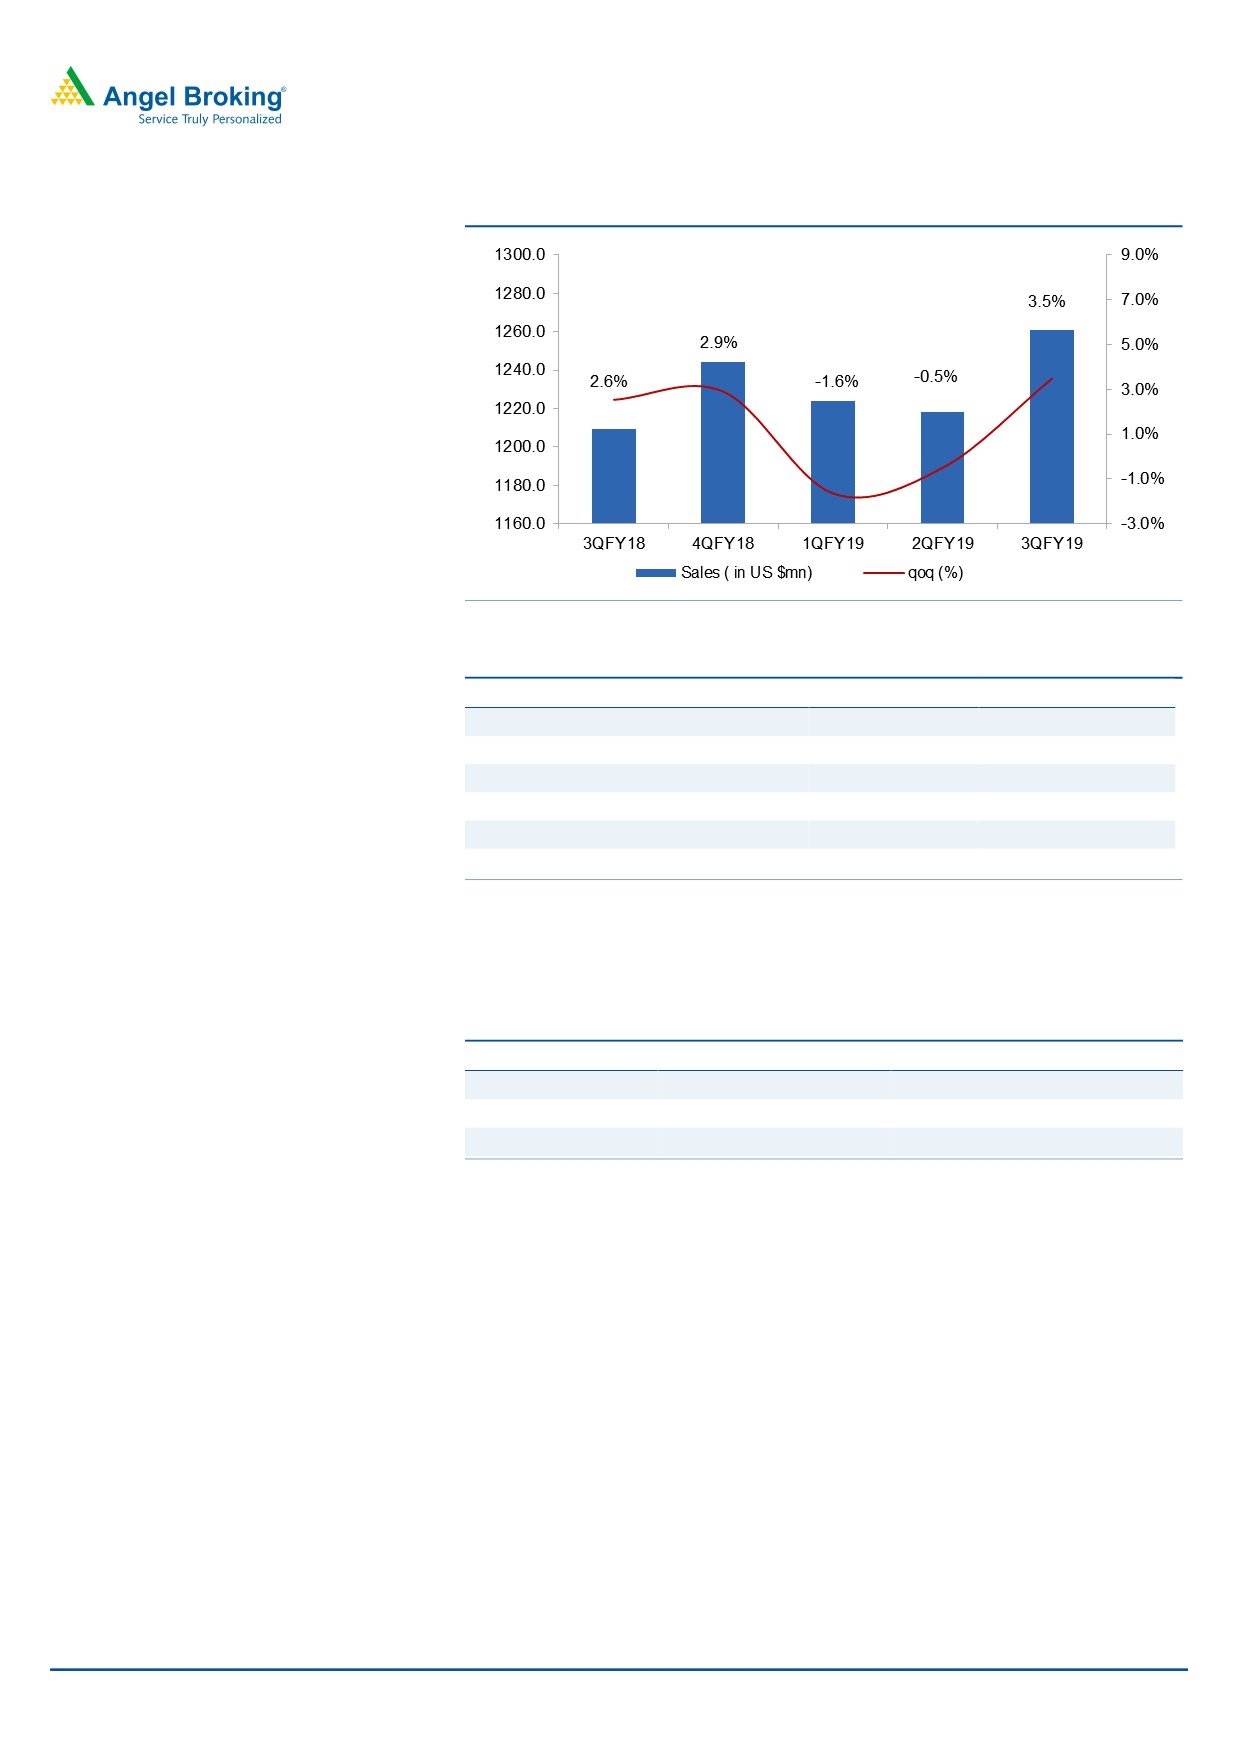
For 3QFY2019, Tech Mahindra posted good set of numbers. Revenues rose 3.5%
qoq to end the period at US$1,261mn. On CC (constant currency) terms of the
4.3% qoq. In Rupee terms, revenues came in at `8,944cr v/s. `8,630cr in 2QFY2019,
up 3.6% qoq.
In terms of geography, USA constituted 47.4% of sales, a qoq growth of 4.4%,
while ROW was the key growth driver constituting 23.7% of sales, posting a qoq
growth of 4.8%. Europe, on the other hand posted a qoq growth of 1.0%.
In terms of the industries, the manufacturing came in at 20.5% of sales, posting
a qoq growth of 5.6% and was the main driver of growth. BFSI, which lead the
segment, contributing around 13.4% of sales, posting a qoq growth of 2.7%.
The key domain Retail, Transport & Logistics, posted a qoq growth of 6.7%. In
addition, the Technology, Media & Entertainment, posted a qoq de-growth of
0.8%. Communication, which is 41.1% of sales, posted a qoq growth of 2.5%.
In terms of services, growth continued to be led by BPO, which grew by 13.4%
qoq, while IT services grew by 2.8% qoq during the quarter. This is also reflected
in terms of the headcount, which has seen a steady rise in last three quarters V/s
flat or no additions in the IT services.
February 6, 2019
2
Tech Mahindra | 3QFY2019 Result Update
Exhibit 2: Trend in revenue growth
Source: Company, Angel Research
Exhibit 3: Growth in industry segments
Particulars
% to revenue
% growth (qoq)
Telecom
41.1
2.5
Manufacturing
20.5
5.6
TME
7.0
-0.8
BFSI
13.4
2.7
RTL
6.7
6.7
Others
11.3
4.4
Source: Company, Angel Research
In terms of geographies, ROW posted growth of 4.8% qoq, while Europe and US
posted a growth of 1.0% and 4.4% qoq respectively.
Exhibit 4: Growth trend in geographies
Particulars
% to revenue
% growth (qoq)
Americas
47.4
4.4
Europe
28.9
1.0
RoW
23.7
4.8
Source: Company, Angel Research
February 6, 2019
3
Tech Mahindra | 3QFY2019 Result Update
Hiring and client metrics
During the quarter, the company reported a net addition of 3,451 employees,
taking its overall headcount to 1,21,842. The BPO headcount currently stands at
43,439. Attrition (on LTM basis) was at 21%.
Exhibit 5: Employee metrics
Particulars
3QFY18
4QFY18
1QFY19
2QFY19
3QFY19
Software professionals
73,460
72,437
72,462
72,534
71,785
BPO professionals
35,496
34,190
34,700
39,407
43,439
Sales & support
6,180
6,180
6,390
6,450
6,618
Total employees
1,12,886
1,12,807
1,13,552
1,18,391
1,21,842
Attritions (%)
17
18
19
20
21
Source: Company, Angel Research
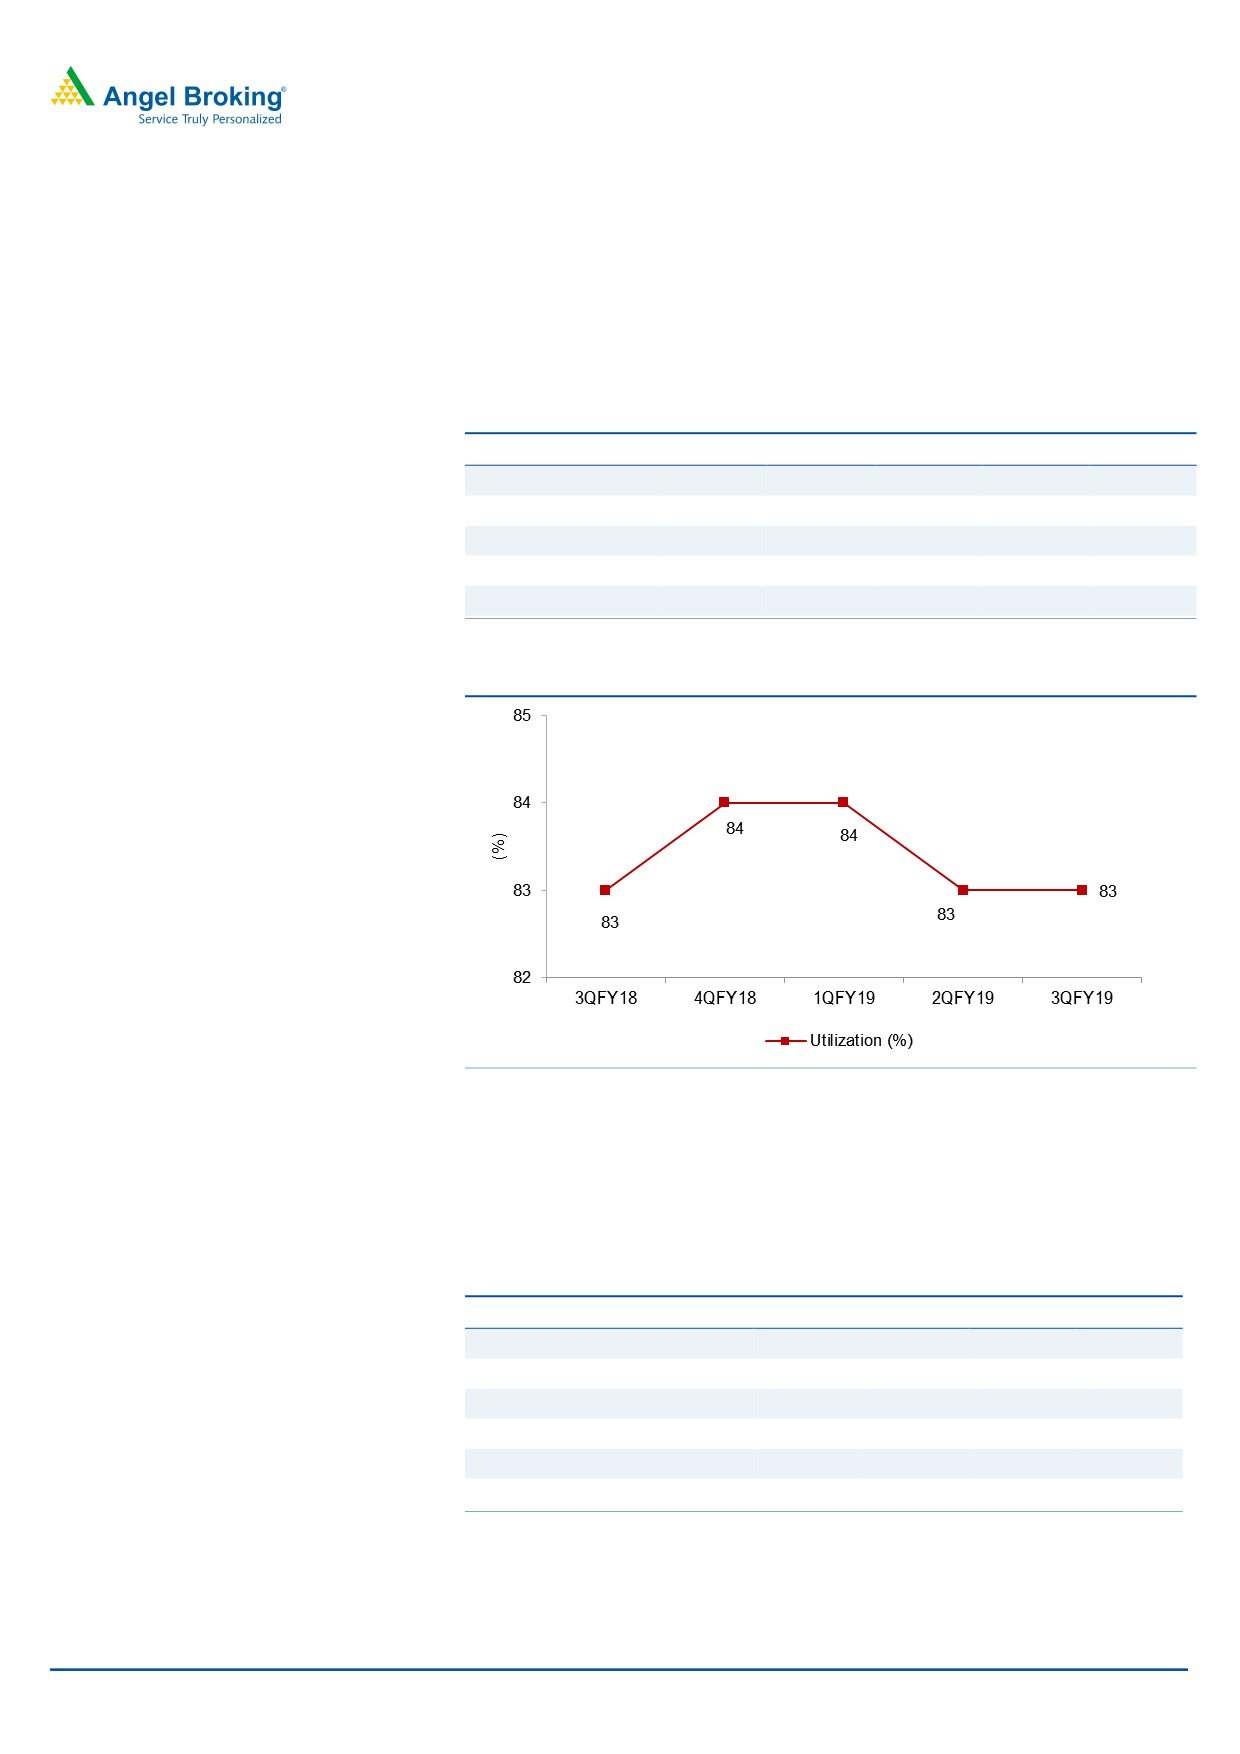
Exhibit 6: Trend in utilization rate
Source: Company, Angel Research
On the client additions front, the company added 5 clients. One client each was
added in the more than US$20mn and US$50mn each. In addition, in terms of the
growth drivers, the main driver has been client additions during the quarter, with
repeat business contributing 94.6% v/s. 97.4% in 2QFY2019.
Exhibit 7: Client metrics
Particulars
3QFY18
4QFY18
1QFY19
2QFY19
3QFY19
Total active clients
903
913
926
930
935
US$1mn-5mn
235
236
242
250
259
US$5mn-10mn
71
71
68
71
69
US$10mn-20mn
43
41
39
41
42
US$20mn-50mn
24
24
31
28
28
US$50mn+
16
16
16
17
18
Source: Company, Angel Research
February 6, 2019
4
Tech Mahindra | 3QFY2019 Result Update
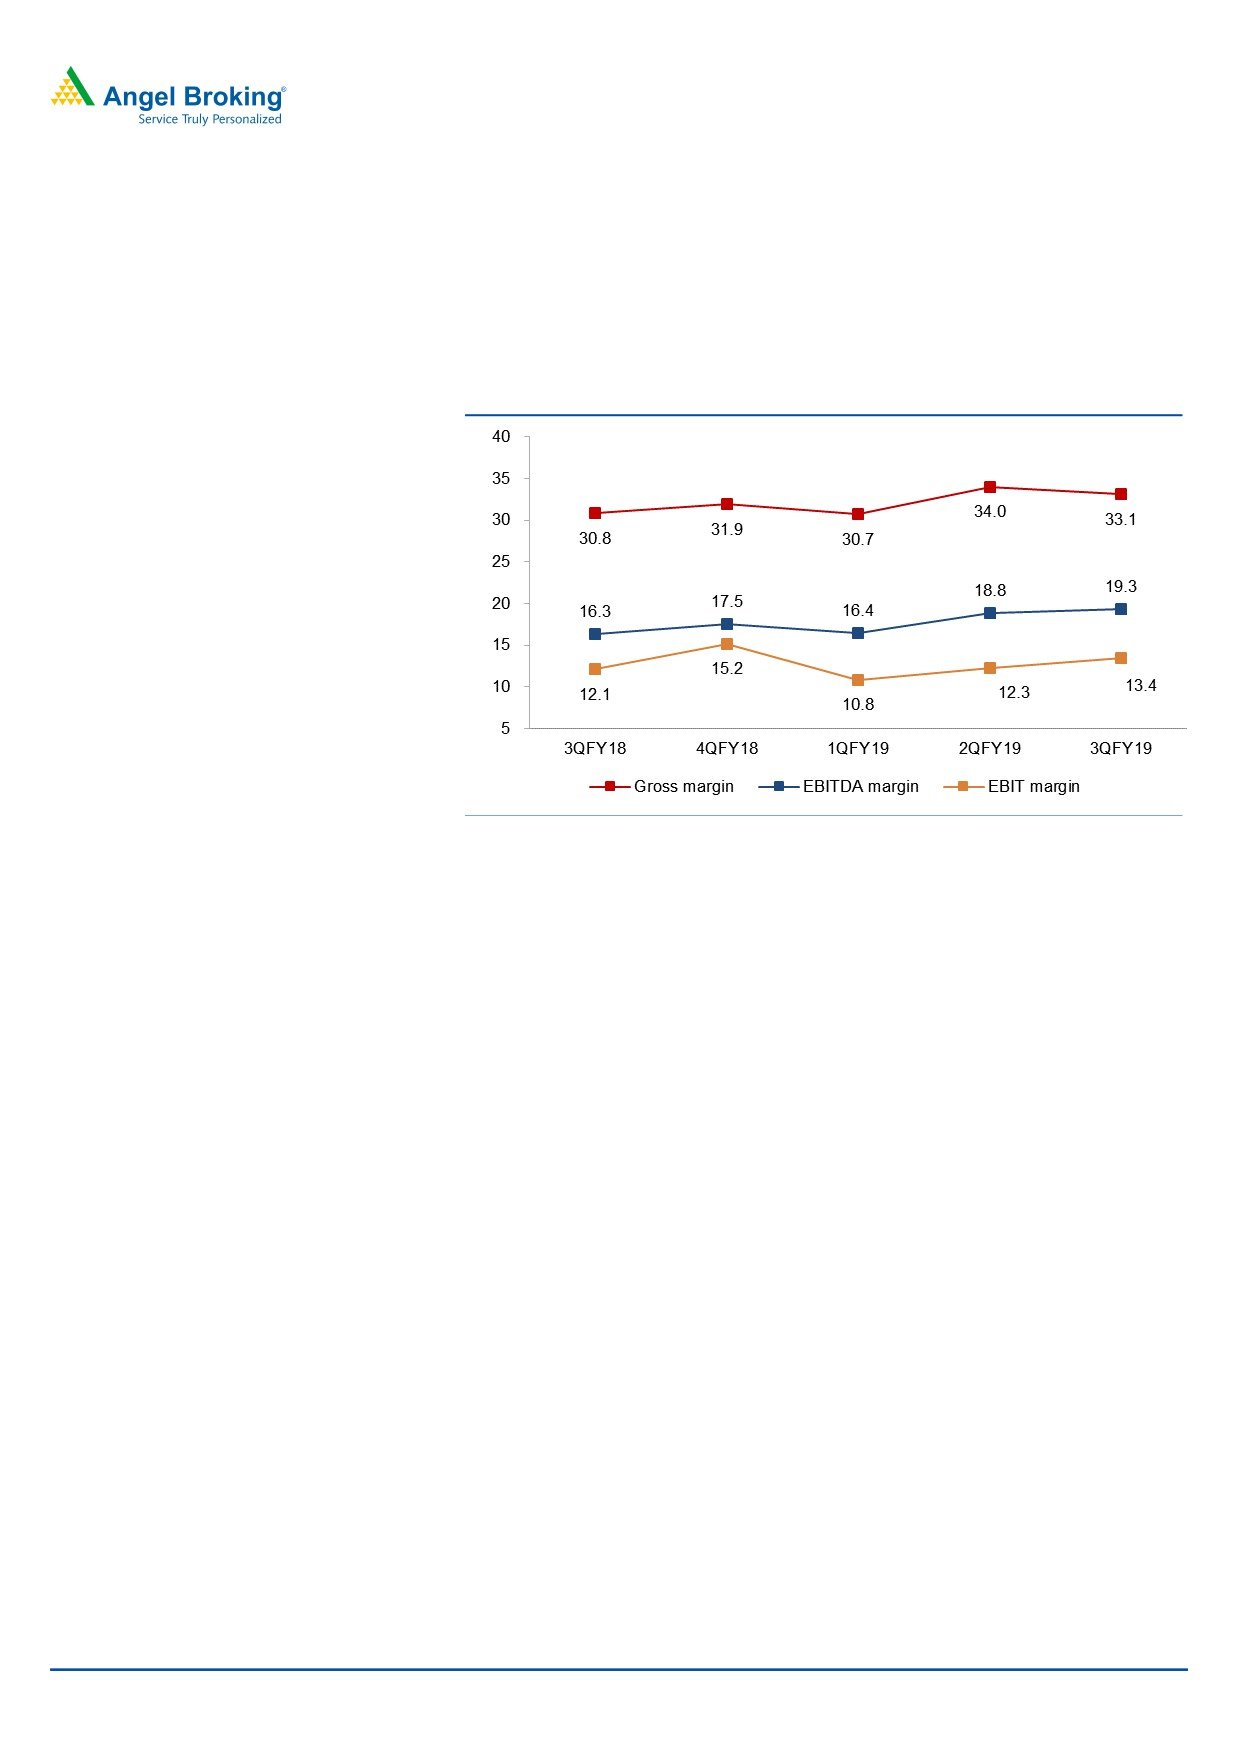
Operating margin expands
On the operating front, the utilization levels during the quarter came in at 82%
v/s. 81% in 2QFY2019, which along with volumes also aided the margins to come
in higher. On the operating front, the EBITDA margin came in at 19.3% v/s. 18.8%
in 2QFY2019, a qoq expansion of 50bps.
Exhibit 8: Margin trend (%)
Source: Company, Angel Research
Investment arguments
Growth prospects decent: Over the last one year, the IT services of the company
has just about been decent one, as reflected by the 9MFY2019 performance;
where the segment has posted a 12.8% yoy, while BPO which has seen robust
additions has witnessed a yoy growth of 26.3%. In addition, its main industry
Communication did not witnessed much growth during the year, while the growth
was much driven by the manufacturing & TEM space. Thus unlike large players
which benefit from the uptick in the growth in the Industry; Tech Mahindra; on a
best case scenario just matches the Industry growth and depends on the
Telecommunication spends. Thus in near term the company is depended on the
5G spends which are expected to come out by 2020 and mostly likely reflect by
FY2021. Thus, on a medium term, the company might just match the Industry
growth; however, concerns over long-term drivers to sustain the growth
organically persists.
Operating performance on an uptick: On the margin front, improvement, on
the back of synergies and productivity gains has started reflecting from
2QFY2018. Company has continued its margin recovery since then. For 3QFY2019,
the company posted margins of 19.3% on EBDITA affront from 14.4% in FY2017.
While there are still levers in terms, of the improved business mix, uptick in deal
size and productivity, however given the near term, pressures on employee cost
where tech Mahindra is at risk given the high onsite mix, we expect up moves
from heron to be gradual.
February 6, 2019
5
Tech Mahindra | 3QFY2019 Result Update
Outlook and valuation
We expect a CAGR of 6.8% and 10.2% in USD and INR revenue respectively
over FY2018-21E. The PAT is expected to grow at a CAGR of 10.1% over
FY2018-21E. while the stock has moved up in anticipation of a good uptick in
the communication segment supported by the upcoming 5G opportunity; we
view this opportunity cautiously and believe that given that the core IT
services business of the company is not growing as well as large peers; could
risk the stock performance going forward. Even after factoring a decent uptick
in the sales growth during FY2020-21E, we find that upsides at 14xFY2020E
would be limited, We recommend our neutral rating.
Exhibit 9: Key assumptions
FY2020E
FY2021E
Revenue growth (US$)
7.0
8.5
USD-INR rate (realized)
71.0
71.0
Revenue growth (`)
7.0
8.5
EBITDA margin (%)
19.3
19.3
Tax rate (%)
25.0
25.0
EPS growth (%)
4.3
8.1
Source: Company, Angel Research
Company Background
Tech Mahindra was founded in 1986 as a joint venture between Mahindra Group
and British Telecom (BT) to service the latter. Later on, the company started
servicing other external clients as well (solely in the telecom industry). In June
2009, Tech Mahindra acquired a 42.7% stake in erstwhile Satyam Computers (now
Mahindra Satyam) and now the latter is entirely merged with the company. The
company acquired the companies - LCC and Softgen. These two acquisitions have
been consolidated in 4QFY2015. LCC is one of the world’s largest independent
global providers of network engineering services to the telecommunications
industry. LCC is estimated to have annual revenues of more than US$400mn
(CY2014), with workforce of over
5,700 network professionals across five
continents and more than 50 countries.
February 6, 2019
6
Tech Mahindra | 3QFY2019 Result Update
Profit and loss statement (Consolidated, Indian GAAP)
Y/E March (` cr)
FY2017 FY2018 FY2019 FY2020E FY2021E
Net sales
29,141
30,773
35,500
37,985
41,214
Cost of revenues
20,566
21,530
23,785
25,070
27,201
Gross profit
8,575
9,243
11,715
12,915
14,013
% of net sales
29.4
30.0
33.0
34.0
34.0
SG&A expenses
4,390
4,533
5,112
5,584
6,058
% of net sales
15.1
14.7
14.4
14.7
14.7
EBITDA
4,184
4,710
6,603
7,331
7,954
% of net sales
14.4
15.3
18.6
19.3
19.3
Depreciation and amortization
978
1085
1243
1329
1442
% of net sales
3.4
3.5
3.5
3.5
3.5
EBIT
3,206
3,625
5,361
6,002
6,512
% of net sales
11.0
11.8
15.1
15.8
15.8
Interest expense
129
162
162
162
162
Other inc., net of forex gain/(loss)
778
1,417
481
481
481
Profit before tax
3,855
4,879
5,679
6,320
6,830
Provision for tax
1,002
1,093
1,136
1,580
1,708
% of PBT
26.0
22.4
20.0
25.0
25.0
PAT
2,853
3,786
4,543
4,740
5,123
Exceptional item
-
-
-
-
-
Minority interest
40
(14)
45
47
51
Reported PAT
2,813
3,800
4,498
4,693
5,072
Adjusted PAT
2,813
3,800
4,498
4,693
5,072
Fully diluted EPS (`)
32.1
43.0
50.9
53.1
57.4
February 6, 2019
7
Tech Mahindra | 3QFY2019 Result Update
Balance sheet (Consolidated, Indian GAAP)
Y/E March (` cr)
FY2017
FY2018
FY2019 FY2020E FY2021E
Equity capital
439
442
442
442
442
Preference capital
-
-
-
-
-
Share premium
-
-
-
-
-
Profit and loss
15,998
18,401
20,794
23,291
25,989
Other reserves
0
-
-
-
-
Net worth
16,438
18,843
21,236
23,732
26,430
Secured loans
1,219
1,726
1,726
1,726
1,726
Unsecured loans
-
-
-
-
-
Total debt
1,219
1,726
1,726
1,726
1,726
Other long term liability
537
537
537
537
537
Long-term provisions
620
555
555
555
555
Minority interest
464
509
555
602
653
Amount pending investigation
1,230
1,300
1,300
1,300
1,300
Total capital employed
20,508
23,469
25,908
28,452
31,201
Gross block
11,677
13,924
14,924
15,924
16,924
Accumulated dep.
(5,217)
(6,302)
(7,545)
(8,874)
(10,317)
Net block
6,460
7,622
7,380
7,050
6,608
Capital WIP
373
240
240
240
240
Total fixed assets
6,833
7,862
7,620
7,290
6,848
Investments
2,396
4,691
9,636
13,054
16,733
Long term loans and adv.
2,435
2,646
3,117
3,118
3,119
Interest in TML benefit trust
-
-
-
-
-
Deferred tax asset, net
267
571
571
571
571
Other non-current assets
0
-
-
-
-
Inventories
61
66
66
66
66
Sundry debtors
5,338
6,498
7,136
7,521
8,160
Cash and cash equv.
3,219
3,044
4,000
3,900
3,841
Loans and advances
5,518
5,054
5,054
5,051
5,048
Current investments
-
-
-
-
-
Unbilled revenue
-
-
-
-
-
Sundry creditors
(2,312)
(6,559)
(10,828)
(11,585)
(12,570)
Other liabilities
(2,860)
(403)
(463)
(533)
(613)
Provision
(387)
-
-
-
-
Working capital
8,577
7,700
4,964
4,419
3,931
Total capital deployed
20,508
23,469
25,908
28,452
31,201
February 6, 2019
8
Tech Mahindra | 3QFY2019 Result Update
Cash flow statement (Consolidated, Indian GAAP)
Y/E March (` cr)
FY2017
FY2018
FY2019
FY2020E FY2021E
Pretax profit from operations
2,853
3,786
4,543
4,740
5,123
Depreciation
978
1,085
1,243
1,329
1,442
Exp. (deffered)/written off/others
-
-
-
-
1
Pre tax cash from operations
3,831
4,871
5,786
6,070
6,566
Other income/prior period ad
778
1,417
481
481
481
Net cash from operations
4,609
6,288
6,267
6,551
7,047
Tax
(1,002)
(1,093)
(1,136)
(1,580)
(1,708)
Cash profits
3,607
5,195
5,131
4,971
5,340
(Inc)/dec in
Sundry Debtors
433
(1,160)
(638)
(386)
(639)
Inventories
(21)
(5)
-
-
-
Loans and advances
(1,485)
464
-
3
3
Sundry creditors
36
4,247
4,269
758
985
Others
660
(2,457)
60
70
80
Net trade working capital
(377)
1,089
3,692
445
429
Cashflow from operating activities
3,230
6,284
8,823
5,416
5,768
(Inc)/dec in fixed assets
(1,840)
(1,029)
243
329
442
(Inc)/dec in investments
(1,153)
(2,295)
(4,945)
(3,418)
(3,679)
(Inc)/dec in other non-current assets
0
0
-
-
-
Cashflow from investing activities
(2,992)
(3,324)
(4,703)
(3,088)
(3,237)
Inc/(dec) in debt
(217)
(507)
-
-
-
Inc/(dec) in deferred revenue
-
-
-
-
-
Inc/(dec) in equity/premium
-
0
-
-
-
Inc/(dec) in minority interest
(271)
(45)
(45)
(47)
(51)
Dividends
(924)
(1,447)
(2,105)
(2,196)
(2,373)
Others
376
(1,136)
(1,015)
(186)
(170)
Cashflow from financing activities
(1,037)
(3,134)
(3,164)
(2,428)
(2,592)
Cash generated/(utilised)
(800)
(174)
955
(100)
(60)
Cash at start of the year
4,018
3,219
3,044
4,000
3,900
Cash at end of the year
3219
3044
4000
3900
3841
February 6, 2019
9
Tech Mahindra | 3QFY2019 Result Update
Key Ratios
Y/E March
FY2017
FY2018
FY2019
FY2020E
FY2021E
Valuation ratio (x)
P/E (on FDEPS)
23.4
17.4
14.7
14.1
13.1
P/CEPS
17.4
13.6
11.5
11.0
10.2
P/BVPS
4.0
3.5
3.1
2.8
2.5
Dividend yield (%)
1.2
1.9
2.7
2.8
3.1
EV/Sales
2.5
2.3
2.0
1.9
1.7
EV/EBITDA
17.1
15.3
10.8
9.7
9.0
EV/Total assets
10.5
9.2
9.4
9.8
10.4
Per share data (`)
EPS
32.1
43.0
50.9
53.1
57.4
Cash EPS
43.2
55.3
65.0
68.2
73.7
Dividend
9.0
14.0
20.4
21.2
23.0
Book value
187.3
213.3
240.4
268.6
299.2
Dupont analysis
Tax retention ratio (PAT/PBT)
0.7
0.8
0.8
0.7
0.7
Cost of debt (PBT/EBIT)
1.2
1.3
1.1
1.1
1.0
EBIT margin (EBIT/Sales)
0.1
0.1
0.2
0.2
0.2
Asset turnover ratio (Sales/Assets)
4.3
3.9
4.7
5.2
6.0
Leverage ratio (Assets/Equity)
0.4
0.4
0.4
0.3
0.3
Operating ROE (%)
17.1
20.2
21.2
19.8
19.2
Return ratios (%)
RoCE (pre-tax)
15.6
15.4
20.7
21.1
20.9
Angel RoIC
19.0
18.0
24.7
24.7
24.0
RoE
17.1
20.2
21.2
19.8
19.2
Turnover ratios( x)
Asset turnover (fixed assets)
4.3
3.9
4.7
5.2
6.0
Receivables days
70
79
79
75
75
Payable days
30
80
119
115
116
February 6, 2019
10
Tech Mahindra | 3QFY2019 Result Update
Research Team Tel: 022 - 39357800
DISCLAIMER
Angel Broking Limited (hereinafter referred to as “Angel”) is a registered Member of National Stock Exchange of India Limited,
Bombay Stock Exchange Limited, Metropolitan Stock Exchange Limited, Multi Commodity Exchange of India Ltd and National
Commodity & Derivatives Exchange Ltd It is also registered as a Depository Participant with CDSL and Portfolio Manager and
Investment Adviser with SEBI. It also has registration with AMFI as a Mutual Fund Distributor. Angel Broking Limited is a registered
entity with SEBI for Research Analyst in terms of SEBI (Research Analyst) Regulations, 2014 vide registration number INH000000164.
Angel or its associates has not been debarred/ suspended by SEBI or any other regulatory authority for accessing /dealing in
securities Market. Angel or its associates/analyst has not received any compensation / managed or co-managed public offering of
securities of the company covered by Analyst during the past twelve months.
This document is solely for the personal information of the recipient, and must not be singularly used as the basis of any investment
decision. Nothing in this document should be construed as investment or financial advice. Each recipient of this document should
make such investigations as they deem necessary to arrive at an independent evaluation of an investment in the securities of the
companies referred to in this document (including the merits and risks involved), and should consult their own advisors to determine
the merits and risks of such an investment.
Reports based on technical and derivative analysis center on studying charts of a stock's price movement, outstanding positions and
trading volume, as opposed to focusing on a company's fundamentals and, as such, may not match with a report on a company's
fundamentals. Investors are advised to refer the Fundamental and Technical Research Reports available on our website to evaluate
the contrary view, if any
The information in this document has been printed on the basis of publicly available information, internal data and other reliable
sources believed to be true, but we do not represent that it is accurate or complete and it should not be relied on as such, as this
document is for general guidance only. Angel Broking Limited or any of its affiliates/ group companies shall not be in any way
responsible for any loss or damage that may arise to any person from any inadvertent error in the information contained in this
report. Angel Broking Limited has not independently verified all the information contained within this document. Accordingly, we
cannot testify, nor make any representation or warranty, express or implied, to the accuracy, contents or data contained within this
document. While Angel Broking Limited endeavors to update on a reasonable basis the information discussed in this material, there
may be regulatory, compliance, or other reasons that prevent us from doing so.
This document is being supplied to you solely for your information, and its contents, information or data may not be reproduced,
redistributed or passed on, directly or indirectly.
Neither Angel Broking Limited, nor its directors, employees or affiliates shall be liable for any loss or damage that may arise from or
in connection with the use of this information.
Disclosure of Interest Statement
Tech Mahindra
1. Financial interest of research analyst or Angel or his Associate or his relative
No
2. Ownership of 1% or more of the stock by research analyst or Angel or associates or
No
relatives
3. Served as an officer, director or employee of the company covered under Research
No
4. Broking relationship with company covered under Research
No
Ratings (Based on expected returns
Buy (> 15%)
Accumulate (5% to 15%)
Neutral (-5 to 5%)
over 12 months investment period):
Reduce (-5% to -15%)
Sell (< -15)
February 6, 2019
11